Imagine this: Someone on your marketing team creates an email campaign, with personalized messages to a highly targeted audience — but doesn’t use a dashboard to track delivery, bounces or clicks. Crazy right? What kind of marketer wouldn’t want to track the effectiveness of their campaign?
Well, that’s what direct mailers have always done. Until now, that is, because direct mail tracking can now be managed via real time dashboards available in newer automated direct mail marketing tools.
When I wrote about how to measure direct mail success using several different key performance indicators (KPIs), I explained how to calculate them and evaluate different criteria used to meet your marketing goals.
It’s important to understand how to calculate KPI’s, so that you can properly interpret campaign results. But do you really want to spend your time manually calculating things? With today’s newer tools, you can use built-in dashboards built for direct mail tracking that automatically crunch all those numbers. You even get get charts and graphs that give you an instant visual overview of how your campaign is performing.
In fact, we spend a lot of time helping Postalytics clients use their dashboard because it helps drive quick, informed decisions about what’s working, what’s not, and how you might make adjustments to improve results. Some of our clients review their dashboards daily (if not hourly in some cases!)
How Do You Track Direct Mail?
- Setup A Campaign Dashboard That Collects Delivery And Response Data
The first steps is creating a simple, easy to use dashboard that collects all of the campaign data for the mailer you’ve sent. You can do this with tools like Excel, with marketing analytics tools, or with direct mail automation tools with built in dashboards.
- Incorporate Delivery Tracking Via The USPS Intelligent Mail Barcode System
For qualified mailers, the USPS has a sophisticated tracking system, that enables mailers to understand where in the delivery process each mailer is. The IMB system is used internally by the USPS for tracking, and it is also available to marketers.
- Use Response Tracking Tools Like Personalized URLs (pURLS) and QR Codes
By using pURLs and QR codes on your mailers, you can identify each recipient when they go online to respond to your mailer. Your dashboard tool should be able to easily capture this data and present it in various charts and graphs.
Direct mail tracking with a 360-degree view
At Postalytics, we’ve taken great care to design a dashboard that’s intuitive and easy to use — whether you want a broad overview or to drill down into more detail. Let me show you how you might use our dashboard so you can spend time more effectively.
For delivery tracking, Postalytics leverages the Intelligent Mail Barcode (or IMB) service from the USPS. Our software associates a unique barcode with every contact and every piece of mail that gets processed through Postalytics.
Once your direct mail pieces enter the USPS mail stream, those bar codes are scanned as they move through the system so you can start tracking actual delivery. For example, you can see how many pieces have been sent and the current status of each mailer:
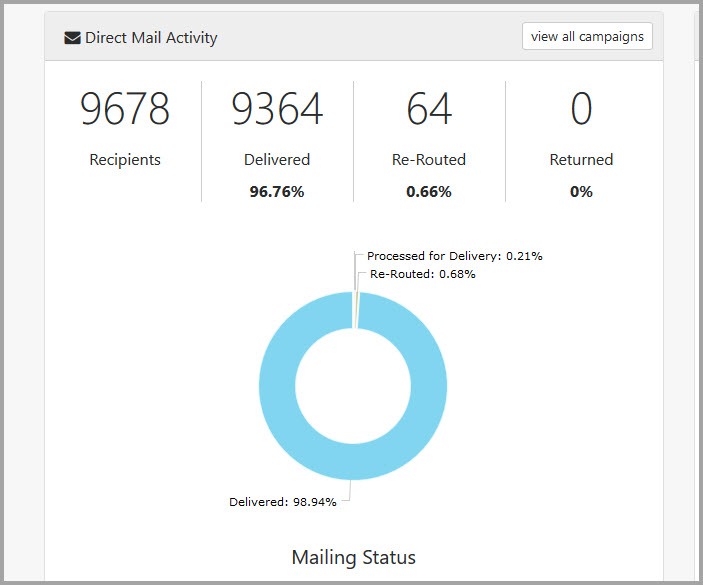
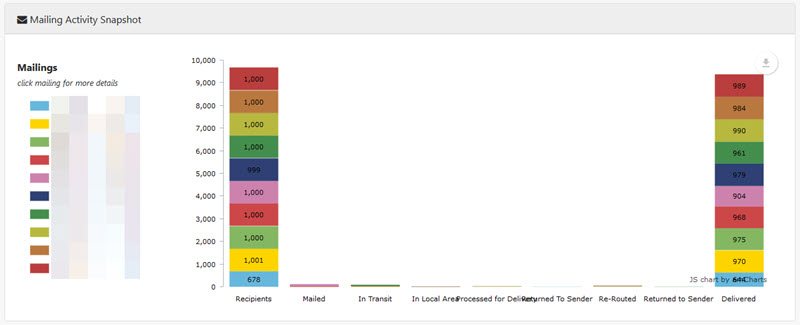
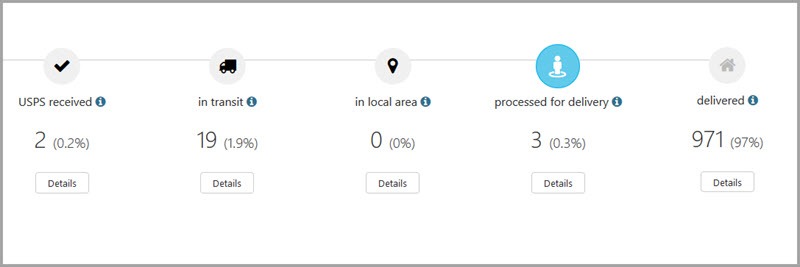
Drilling in further, you can see how your mail is categorized in easy to understand steps. Postalytics does the heavy lifting for your direct mail tracking by summarizing up to 200 different scan events that the USPS sends out as mail is moving through their delivery cycle.
This example alone demonstrates the value of a sophisticated dashboard, but mailing your package is only the first step. It’s how your mailings perform against your objectives that adds far more value.
Your Postalytics Dashboard:
An overall view of your marketing – and all the details
Are your mailings successful? Perhaps not-so-successful and need refinement? Or perhaps you’ve missed the mark and need to make major changes as soon as possible. We all make mistakes, but it’s how soon we can correct them that really counts in building a successful marketing program. In fact, our most successful clients tend to be those that know how valuable our direct mail tracking dashboard tools can be.
Take a look at our Campaign Dashboard. This is essentially “mission control” for your direct mail program. You can use it to review all of your campaigns, benchmark performance against your objectives, and analyze results in real time – all at a glance.
If you’re following direct mail best practices, you’re using unique codes to track individual responses to your mailing. For example, if your offer is redeemed online, that code can take the form of a unique personalized URL (pURL) that gives you overall results as well as recipient level reports.
You might have several campaigns running simultaneously. It’s easy to drill into a specific campaign. For example one campaign might be to improve on-boarding engagement for new clients.
How to use direct mail dashboard delivery tracking events
Let’s say this campaign to boost engagement during the on-boarding process is designed so an account manager can follow up with a call within two days of a customer receiving the mailer. Your delivery data screen shows various status categories – including “created”, ”sent”, “in transit,” and others until you see the status changes to “delivered.” Your account managers can follow up individually as these letters are delivered to each new client.
This type of visibility into direct mail delivery has never been previously available.
Even better, there’s no need to keep logging in to your dashboard to track each individual maining. We’ve made it possible to automatically deliver that information to your account team if you’re using a modern CRM with an API.
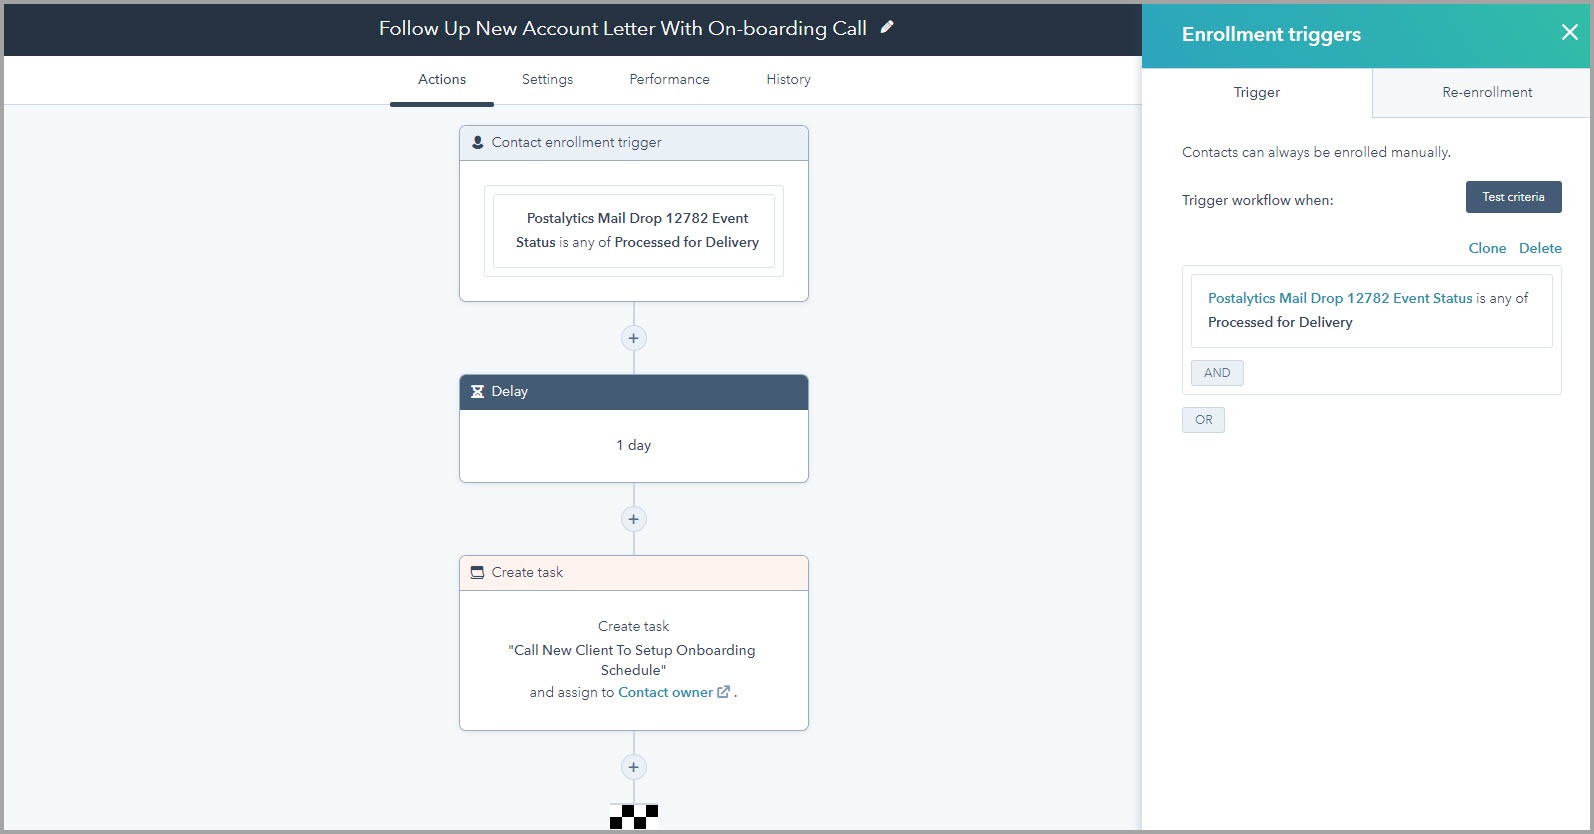
Here’s an easy example. When that new client on-boarding letter gets the “processed for delivery” scan from the USPS, this HubSpot Workflow waits one day and then automatically kicks off a task for the Contact Owner to make that phone call. (There are a ton of workflow integrations available).
Instant, multi-channel campaigns are now within the reach of marketers everyone by using the direct mail tracking events now available in Postalytics dashboards.
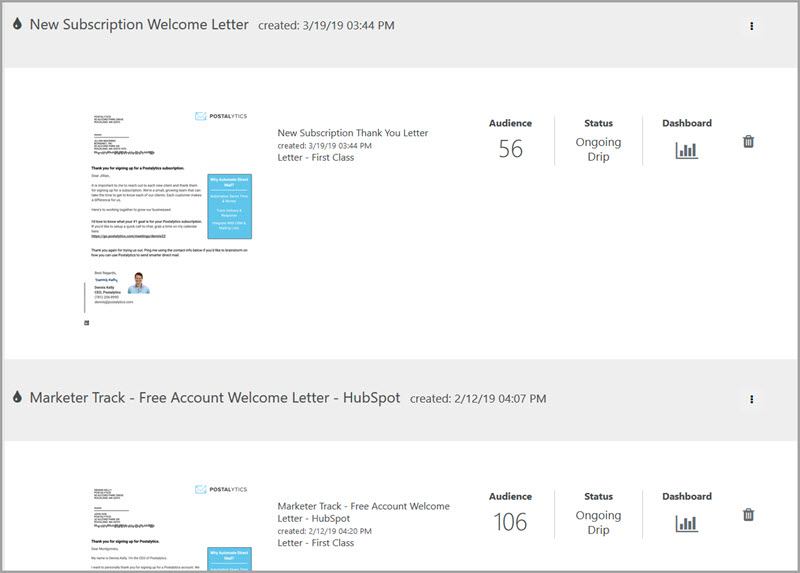
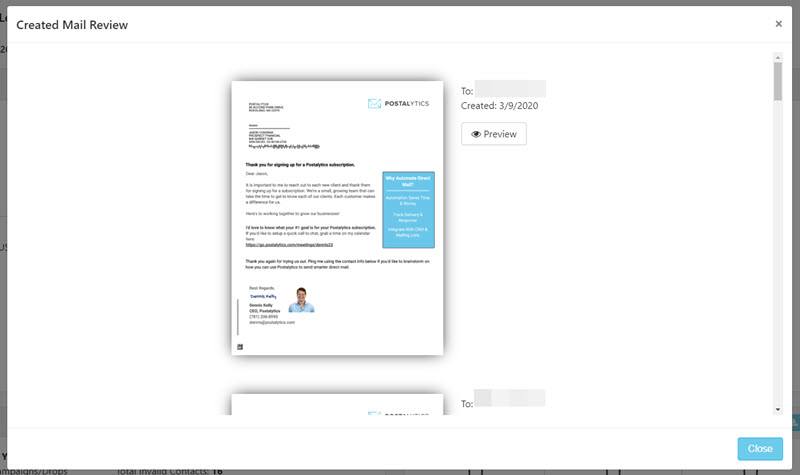
If you need a reminder of what’s been sent, you can always take a look at an image or PDF of the actual mailing. Just click on “Preview Created Mail” to see the format, copy, design, and offer:
Smart direct mail dashboards update your list with deliverability data from campaigns
Just like with email marketing, deliverability issues can be common because lists are rarely perfect. Some may perform great. Others might be pulled from your an old customer list in your CRM, and you know that a good percentage of the names and addresses won’t be valid. One essential best practice is to capture invalid addresses as soon as you can so that on subsequent touches (see Multi-touch Direct Mail Campaigns Perform Better), you don’t waste any more money on bad addresses.
How do marketers without a smart dashboard do this? By manually collecting returned mail, and then manually updating address data. Returned mailpieces trickle in for up to 30 days after a mailing goes out. As a result, the underlying data doesn’t get fixed without a long delay and a lot of manual work. It often doesn’t get fixed at all.
You’ll save money if your direct mail tracking dashboard is smart enough to connect to your list and set aside as undeliverable any contacts discovered by the USPS as invalid as soon as possible. Your Contact List Health panel of the Campaign Dashboard makes this easy:
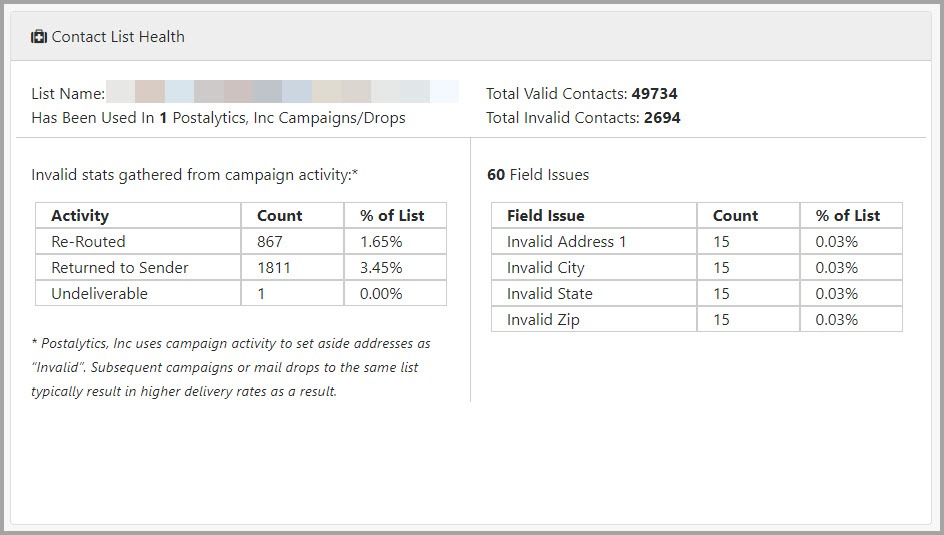
This screen gives you a quick snapshot of the number of valid and invalid addresses – plus data for records that may be incomplete and require additional information.
For example, this shows that about 3.5% of this list was scanned as “Return To Sender” by the USPS. That’s pretty high. It also shows that Postalytics blocked 60 contacts from even going out to print in the first place because of missing or incorrectly formatted contact fields. You can easily clean up the data for these contacts to include them in your next mailing to this list.
Performance data you need to fine-tune your campaigns
So far, we’ve
shown how you dashboard summarizes your planning and execution, but what about
what’s really essential – results?
Just like with email marketing, your direct mail tracking dashboard can give you detailed information on exactly who has responded to your mailers, and which of your web pages they visited.
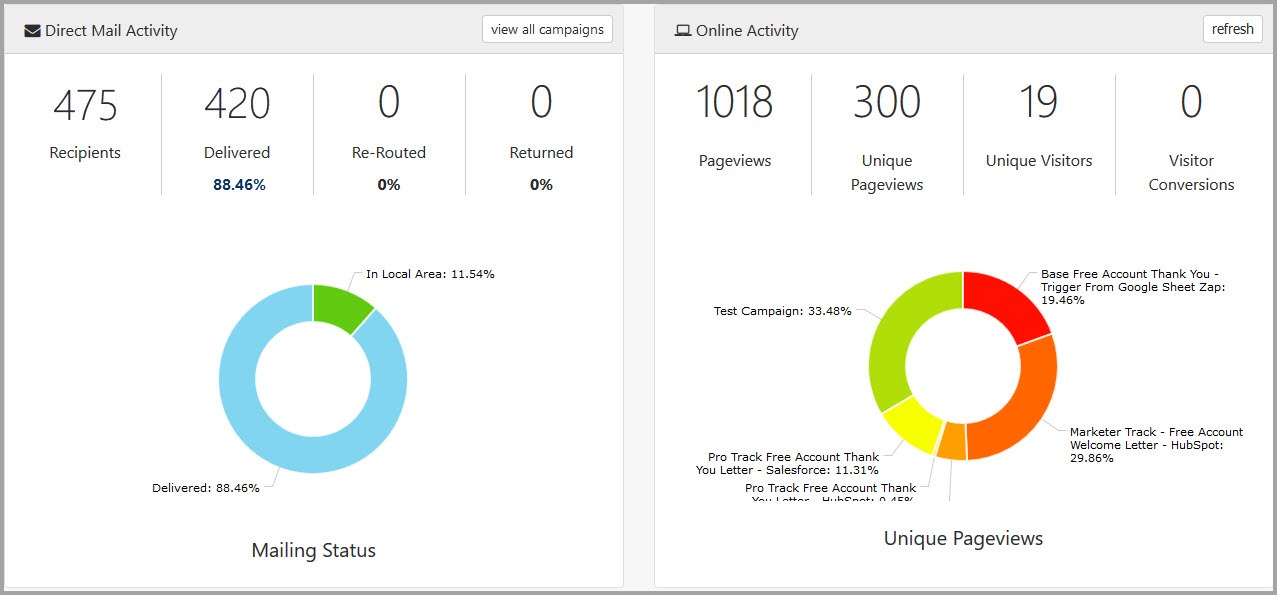
Because today’s consumers and business buyers tend to respond online, it’s likely that your direct mail package includes an offer that encourages prospects to visit a specific web page. Your Online Activity Panel shows how many unique visitors you are receiving, number of unique page views, and of course additional activity that represent conversions – to a sale or moving a prospect along a sales funnel.
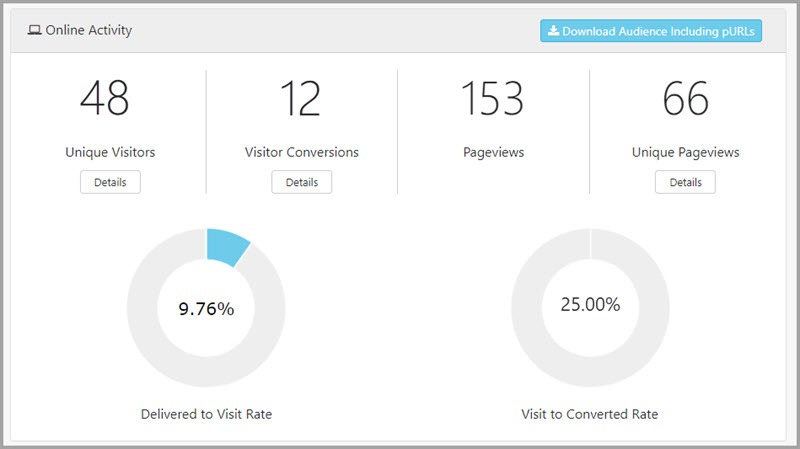
This example show that the campaign has generated 153 page views and 12 conversions. You can also ratios that represent your response rate and conversion rate. Remember, a high response rate or a large number of page views is excellent, but not at the expense of a low conversion rate. Ultimately, you want to meet your objectives, but so do by sending as few mailings as possible to reduce your mailing costs.
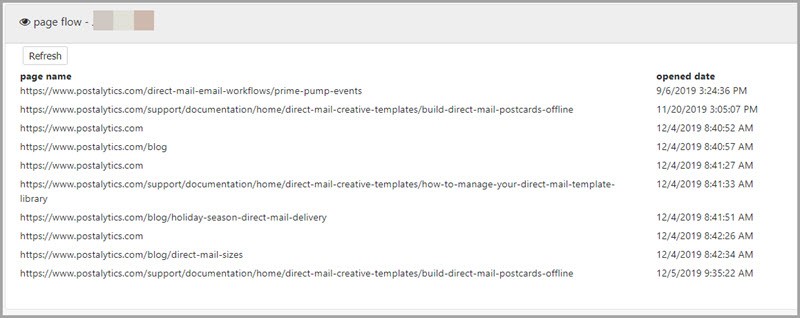
While this view displays overall information summarizing a complete campaign or mailing, you can also easily drill down into intricate details. With the “page flow” panel, you can see precisely the web pages that a specific contact visited, along with the dates and times of their most recent visits.
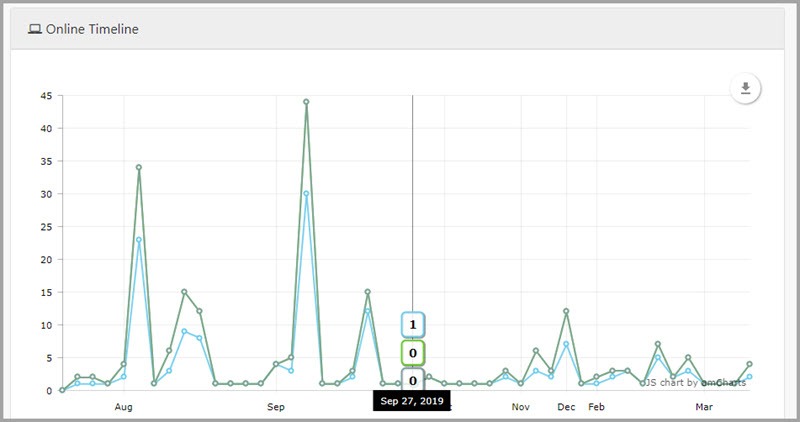
And while these screens show results as snapshot, you can also track direct mail performance trends over time. Triggered Drip campaigns, that send out postcards and letter from automated workflows in CRM systems, trickle mailers out one at a time. That on-boarding campaign is a great example. Here, the “online timeline” panel shows the online activity of this campaign over a several month period:
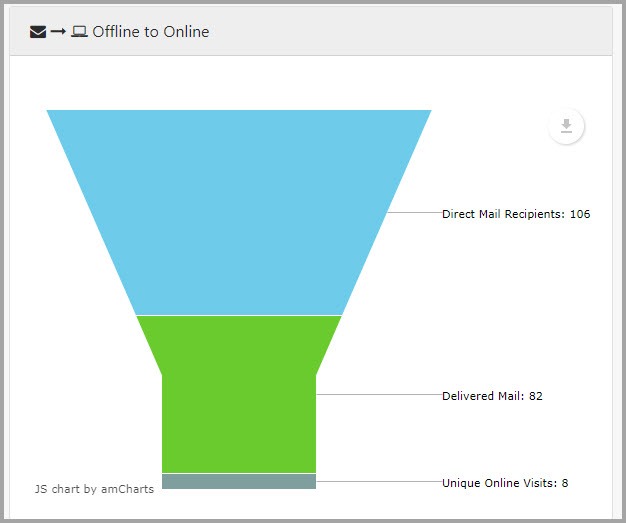
Finally, you can also view how your offline media generates online responses and conversions in the form of a funnel — showing performance at each stage of the campaign funnel. This can help you spot trends that can help you make adjustments — for example, considering new approaches to converting prospects to sales.
Try out a smart dashboard. Sign up for free and send yourself samples
You can try out a smart direct mail dashboard for yourself. Sign up for a Postalytics Free Account, and test out the “Send Me Samples” feature. You’ll get a sample of Postalytics direct mail sent to you, with a unique Personalized URL to scan or enter. You’ll be able to see how the dashboard works for yourself, without making any commitment.
Check out the free account and join thousands of smart marketers who are seeing for themselves how smart direct mail dashboards help drive better results.
About the Author

Dennis Kelly
Dennis Kelly is CEO and co-founder of Postalytics, the leading direct mail automation platform for marketers to build, deploy and manage direct mail marketing campaigns. Postalytics is Dennis’ 6th startup. He has been involved in starting and growing early-stage technology ventures for over 30 years and has held senior management roles at a diverse set of large technology firms including Computer Associates, Palm Inc. and Achieve Healthcare Information Systems.