Logs are valuable assets for users and developers to help better understand exactly what is happening behind the scenes in Postalytics. Logs are filled up with “Events” that occur during the creation, mailing and tracking of direct mail campaigns when you use an automated tool.
What is the Postalytics Log Viewer?
The Log Viewer is a tool that enables you to slice and dice and quickly look at the details around these events. There are different event logs that can be viewed to help users drill down into details that are not easily accessed in the Postalytics user interface.
Who can use the Postalytics Log Viewer?
Typically, users who are technical are interested in using the Log Viewer, but there’s no limitation on use. Event logging is often used when developers or others are integrating Postalytics with another system via the API or via the Postalytics integrations. By viewing the details around the events created by Postalytics, you can help determine whether tests are working properly or whether there have been any errors as campaigns are processing, taking in calls from 3rd party systems or sending calls out to 3rd party systems.
What are the Log Viewer Logs?
There are 3 different logs that can be viewed with the Log Viewer and many different types of events that get logged by Postalytics in each of the three Logs.
Event Logs
Event Logs contain the events that fill up your Campaign Dashboard with delivery and response activity. Each time there’s a change of status on a piece of mail, it is logged and recorded in an Event Log. Examples include:
- Mailpiece created
- Processed for Delivery
- Returned to Sender
- pURL Opened
Webhook Logs
Primarily used by customers that are building or testing integrations, these are logs of the events from outgoing posts from Postalytics to an endpoint that is defined in our webhooks settings.
As webhooks are being processed by Postalytics, the events (same event types as the Event Logs above) become available within the Log Viewer. Along with the log entry is the status that the external webhook sent back to us. This will help you determine if the external receiver was successful or not. And if not, you will see additional status information to help you debug.
Incoming API Logs
These are logs filled with events that are generated by Triggered Drip Campaigns that use the “Incoming Webhook URL” integration feature or other calls to our suite of API endpoints. Here we capture each time a webhook is posted by your CRM or Marketing Automation tool.
The event types here are quite different from the Event Logs and Webhook Logs. These events are created to help understand whether a trigger actually went through properly. Examples of the types of events include:
- OK
- Created
- Accepted
- BadRequest
- Unauthorized
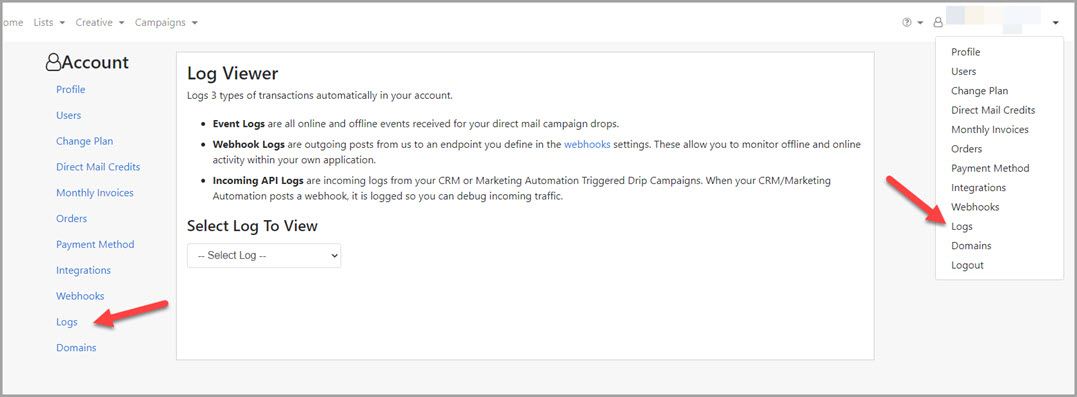
How To Use The Log Viewer
It is simple to drill down to see the details of the events that are logged in Postalytics with the Log Viewer.
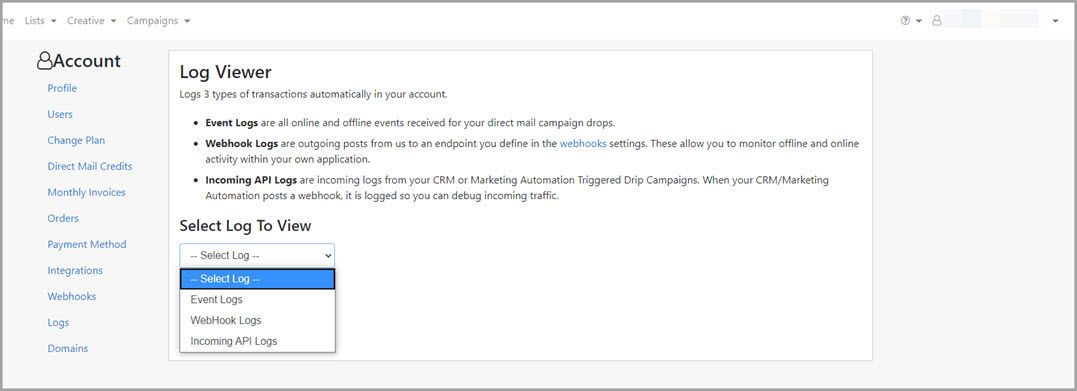
First, select the Log Type to view: Event, Webhook or Incoming API
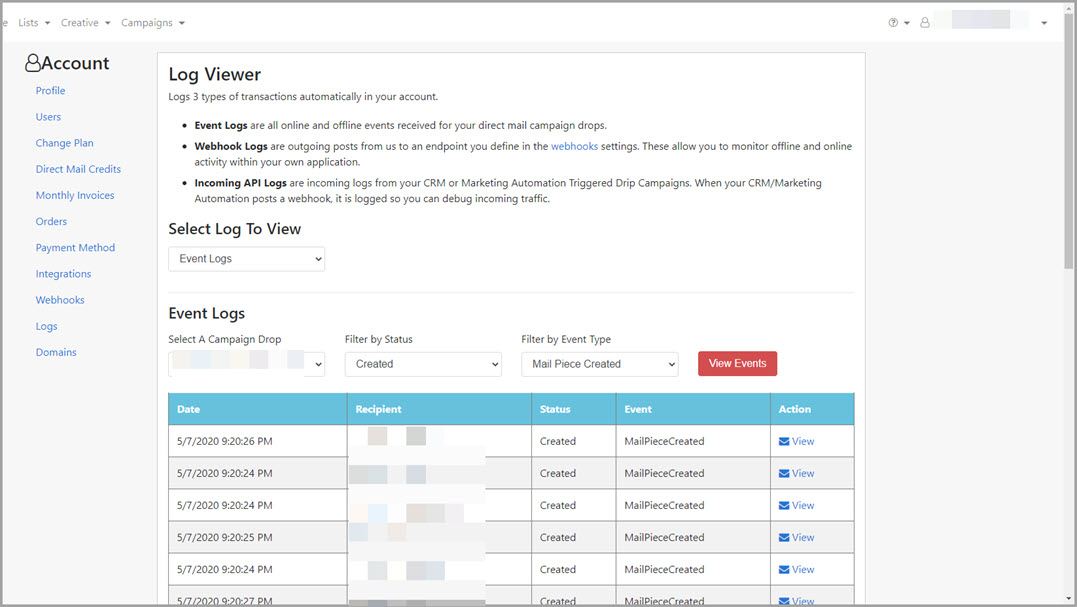
Next, select the Campaign Drop (campaign name) that generated the events you want to review.
Finally, you can filter the events by event status (such as All, OK, Created, BadRequest, etc. and by the event type (All, Mailpiece Created, pURL Opened, etc) and click “View Events”
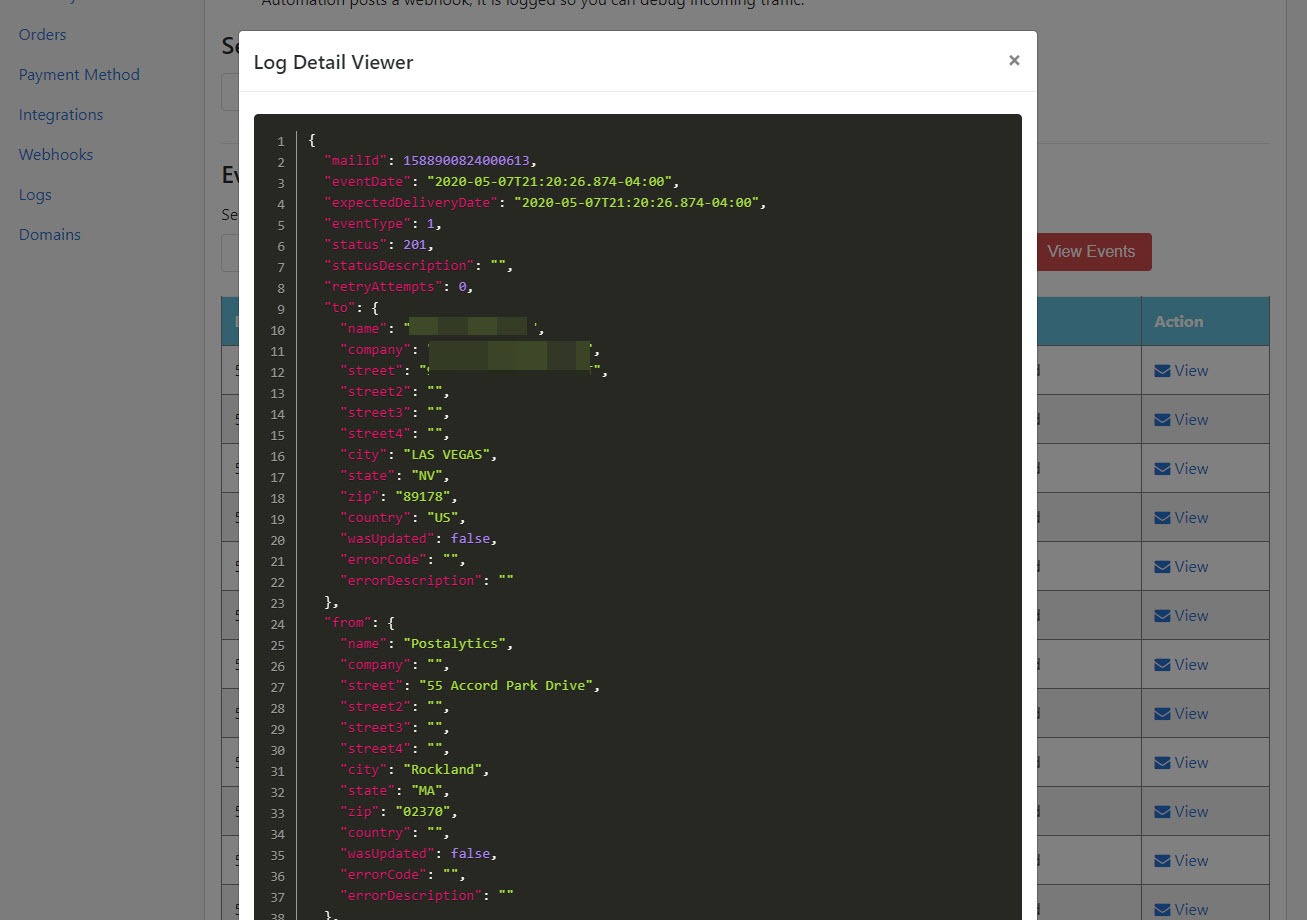
After you’ve filtered the events down, you can click on the “View” button to see the raw details of the event in the Log Detail Viewer. Here, you might find that a contact was missing a zip code or other details to help you better understand what has happened behind the scenes:
If you have any questions on how to use the Log Viewer, or if you’d like to speak with us about your integration with Postalytics, don’t hesitate to contact us!